Growth


by Angus MacCaull
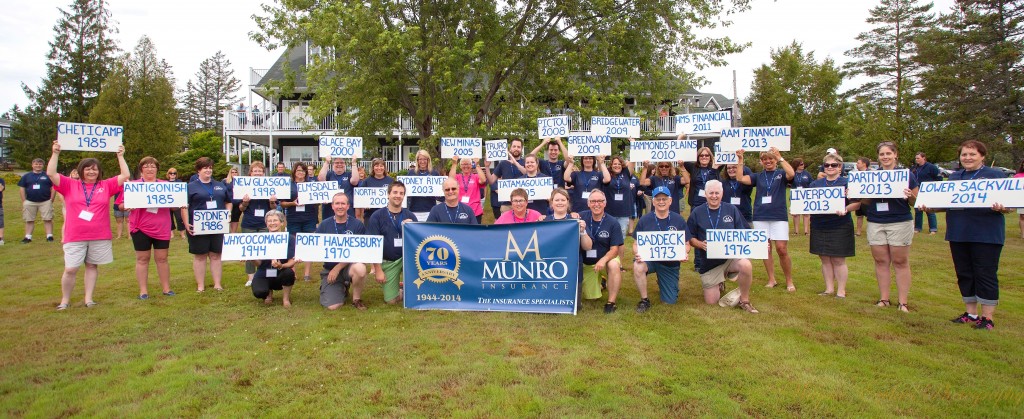
Here’s a nice picture of what organic growth can look like. Maggie MacLean made the signs by hand. I’m pretty sure that the signs were handed out fairly randomly, but it would be neat to see if there are any personal connections between any of the people holding the signs and the communities represented. For example, does Donna have any connection to New Glasgow? Does she shop there? Or does Glenda have any connection to Tatamagouche? Does she go swimming there?
2014 Lower Sackville
2013 Dartmouth
2013 Liverpool
2013 AAM Financial (province-wide)
2012 Mabou
2011 HMS Financial (province-wide)
2010 Hammonds Plains
2009 Bridgewater
2009 Greenwood
2008 Pictou
2005 Tatamagouche
2005 Truro
2005 New Minas
2003 Sydney River
2000 North Sydney
2000 Glace Bay
1999 Elmsdale
1998 New Glasgow
1986 Sydney
1985 Antigonish
1985 Cheticamp
1976 Inverness
1973 Baddeck
1970 Port Hawkesbury
1944 Whycocomagh
Leave a Reply